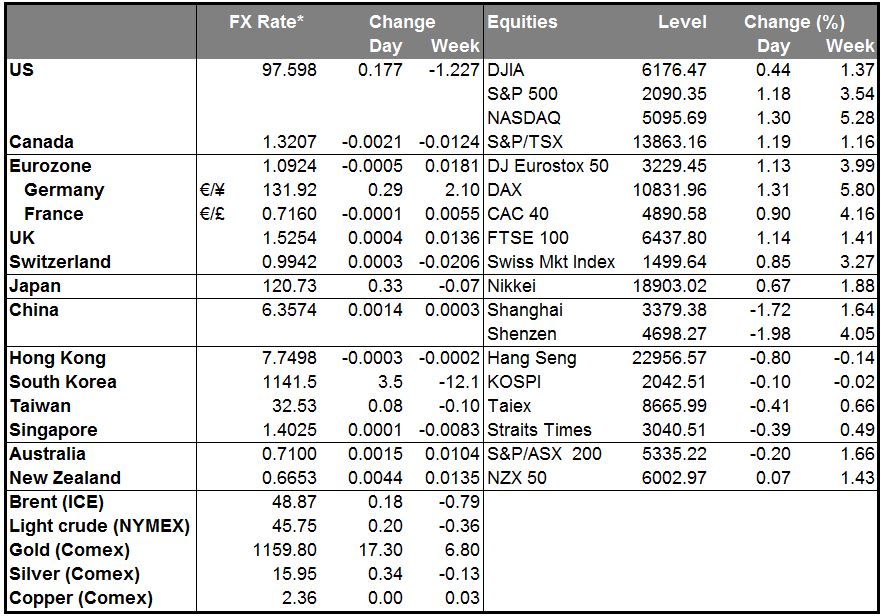
• Fed leaves the door open for a December hike Fed officials held off on raising interest rates, but signaled a hike could come at their December meeting, if they see progress in both realized and expected objectives of maximum employment and 2% inflation. This is the first time that the policymakers explicitly said they may raise interest rates at their next meeting, pushing the probability of hike from around 30% ahead of the meeting to almost 50% afterwards. Another important development was that the Fed dropped from the statement the previous warnings about the global growth concerns and the financial market volatility. At the September meeting, policymakers pointed to worries about global growth and turmoil in financial markets as reasons to leave rates unchanged. Since then, both turned in the Fed’s favor and dollar rallied on the hawkish statement.
• Following the conclusion of the FOMC meeting, we will look closely to the October employment report, the minutes of this meeting and on any Fed speakers going into December meeting for more insights about officials’ view over the outlook of US economy. Recent comments from Fed officials have highlighted the divergence in views between the Committee members. Fed’s Brainard and Tarullo, said that they don’t see a rate hike coming before next year, while Vice Chairman Fischer, Lockhart and Williams shared the view for a hike this year, on the assumption of continued solid economic growth and further improvement in the labor market. Once again, the decision on whether to start normalization this year has become data-driven and significant positive US data surprises are now required for the market to re-price expectations and USD to gain further.
• RBNZ remained on hold but rate cuts are still on the horizon The Reserve Bank of New Zealand kept interest rates unchanged at 2.75% as was widely expected, but said that further reduction in the rate seems likely. Even though the Bank expects the CPI to return within the target range of 1%-3% by early 2016, continued strength in NZD would require a lower rate path than would otherwise be the case. As a result, in order to offset the impact of the strong currency on the inflation outlook, the Bank may cut rates again in the foreseeable future. This limits the upside moves in NZD/USD, in our view.
• Today’s highlights: During the European day, Germany’s preliminary CPI rate for October is forecast to have risen to +0.1% yoy from -0.2% yoy in September. A rise in the inflation rate of Eurozone’s growth engine could indicate a rise in the bloc’s CPI rate to be released on Friday. This could support the euro temporarily, but given the more-dovish-than expected remarks by ECB President Draghi at last week’s meeting, we would treat any rebounds in EUR as providing renewed selling opportunities. Germany’s unemployment rate for the same month is expected to have remained unchanged at 6.4%.
• From the UK, we get the Nationwide house price index for October, and from Sweden, we have retail sales for September. The forecast is for retail sales to have risen 1.5% mom, after declining 1.7% mom in August. A rebound in retail sales will be in line with the Riksbank’s view that expansionary monetary policy is supporting the continued positive development of the Swedish economy. Nevertheless, given that on Wednesday, the Bank decided to extend its QE, and that it still sees considerable uncertainty regarding the strength of the global economy, we would treat any SEK rebounds as providing renewed selling opportunities.
• In the US, the main event will be the 1st estimate of Q3 GDP. Given the drag from net exports and slower inventory accumulation, expectations are for a significant slowdown in Q3 growth despite the solid growth in private consumption. The Fed’s statement on the economy, however, was unchanged and the Committee still expects that with appropriate policy accommodation, economic activity will expand at a moderate pace. If there was going to be a huge downward surprise in the Q3 GDP figure, Fed officials should at least made a reference to it by adjusting that part of the statement. In addition to this, the final Atlanta Fed GDPNow model estimate points to a +1.1% qoq reading, which is higher from an earlier projection of +0.8% qoq. As such, we could see a positive surprise in the GDP reading that may support the dollar. The quarterly PCE deflator is also coming out and the forecast is for the rate to have slowed. Pending home sales for September are due to be released as well. Expectations are for pending home sales to have improved in September, confirming the overall strength of the housing sector and that the decline in new home sales was just an outlier. Initial jobless claims for the week ended on Oct. 19 are also to be released.
• Canada’s PPI September for is forecast to have fallen at a slower pace than in August on a monthly basis.
• We have three speakers scheduled on Wednesday: ECB Vice President Vitor Constancio, Governor of Bank of Finland and ECB Governing Council member Erkki Liikanen, and Atlanta Fed President Dennis Lockhart.
The Market
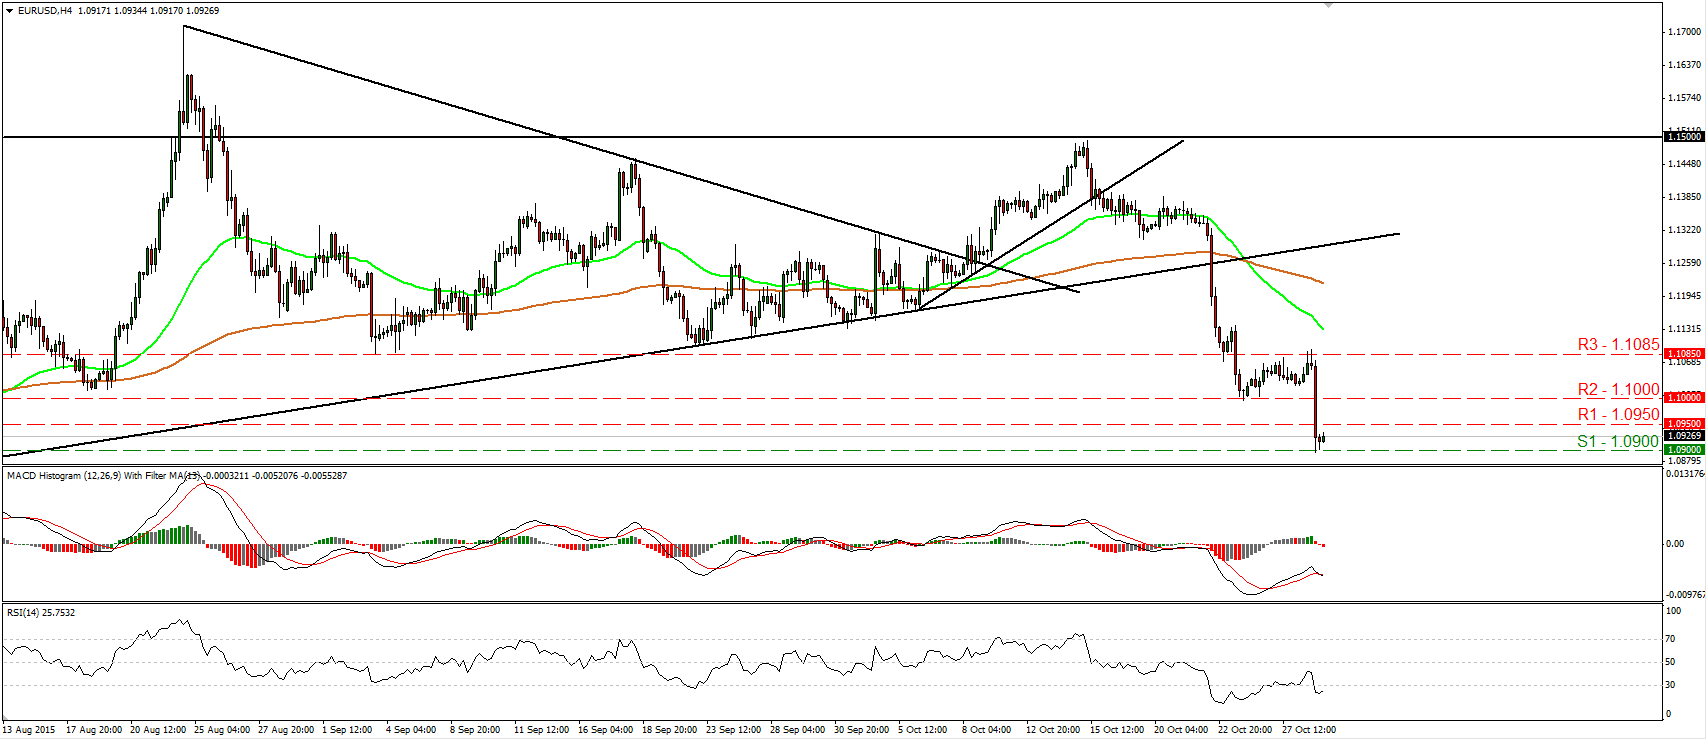
EUR/USD tumbles as Fed leaves the door open for a Dec. rate hike
• EUR/USD tumbled on Wednesday, after the Fed held interest rates unchanged, but sent strong signals that a lift-off will be on the cards at the December meeting. The pair fell after it hit resistance near 1.1085 (R3), broke below the psychological zone of 1.1000 (R2), and hit support at the 1.0900 (S1) level. The price structure on the 4-hour chart still suggests a short-term downtrend and therefore, I would expect a clear dip below 1.0900 (S1) to prompt extensions towards the next support at 1.0850 (S2), marked by the low of the 5th of August. Our short-term oscillators detect strong downside speed and support further declines. The RSI turned down and fell back below its 30 line, while the MACD, already negative, has topped and fallen below its signal line. Nevertheless, the RSI shows signs of bottoming within its below-30 zone, giving evidence that a corrective bounce is possible before the bears decide to shoot again. A significant slowdown in the 1st estimate of the US Q3 GDP today could confirm the case and could bring the rate back above 1.0950 (R1). In the bigger picture, as long as EUR/USD is trading between the 1.0800 key support and the psychological zone of 1.1500, I would maintain my neutral stance as far as the overall picture is concerned. The pair is now headed towards the lower bound of the range, but I would like to see a clear break below the 1.0800 hurdle before assuming that the longer-term trend is back to the downside.
• Support: 1.0900 (S1), 1.0850 (S2), 1.0800 (S3)
• Resistance: 1.0950 (R1), 1.1000 (R2), 1.1085 (R3)
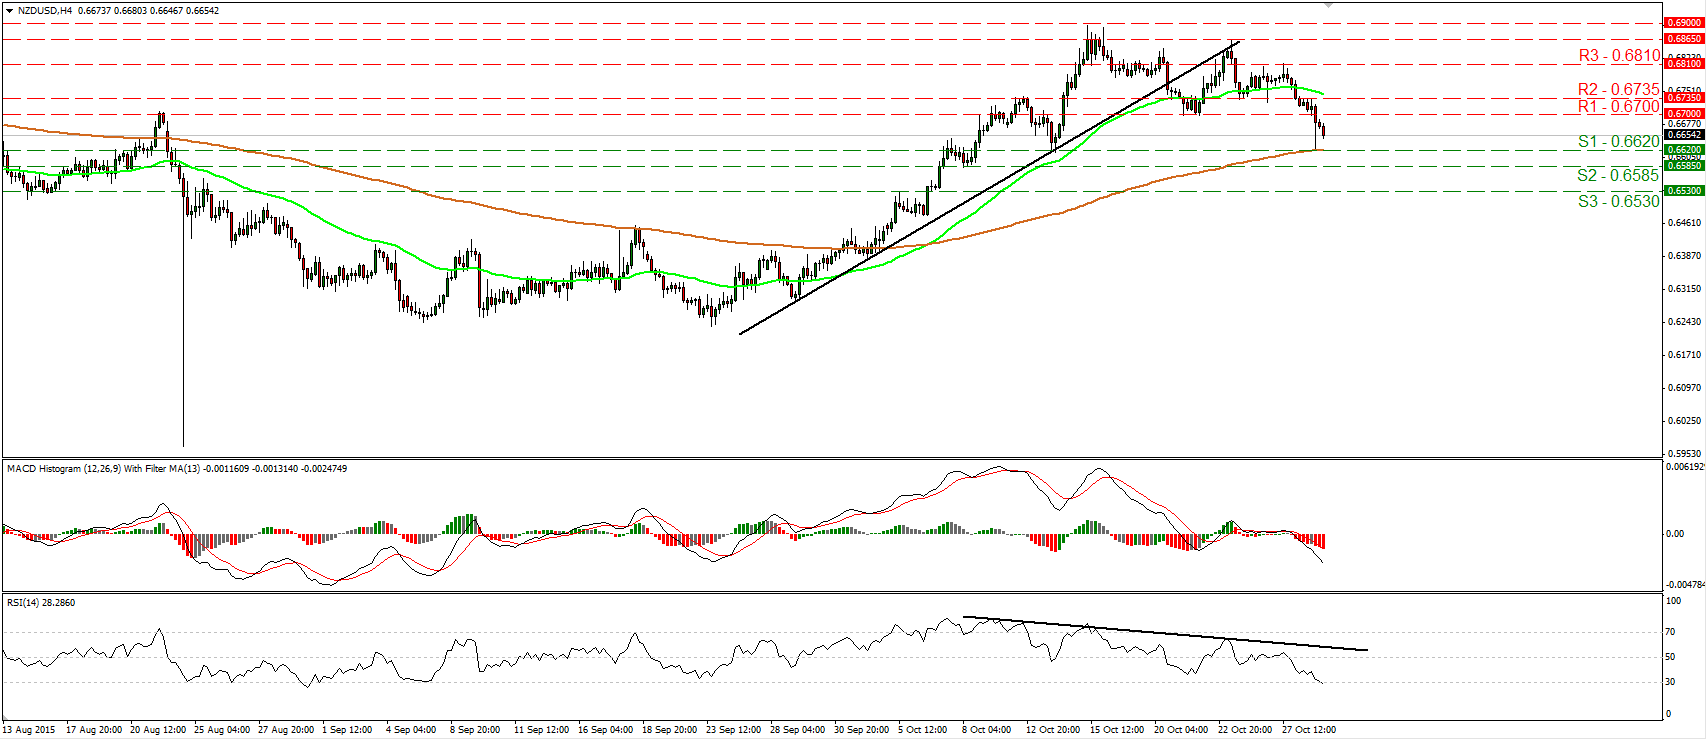
NZD/USD hits the 0.6620 line after the RBNZ meeting
• NZD/USD slid yesterday after the Reserve Bank of New Zealand kept rates unchanged but showed concerns over the strength of the kiwi. The rate fell below the 0.6700 (R1) obstacle and hit support at the next hurdle of 0.6620 (S1) before rebounding somewhat. During the early European morning Thursday, the rate is headed once again towards 0.6620 (S1) and since the short-term picture remains negative, I would expect a move below that level to initially aim for the next support at 0.6585 (S2). Our momentum studies detect strong downside speed and support the notion. The RSI edged lower and just crossed below 30, while the MACD stands below both its zero and trigger lines, pointing south. On the daily chart, the medium-term picture still looks somewhat positive. However, given that there is room for further short-term declines, I would switch my stance to neutral for now.
• Support: 0.6620 (S1), 0.6585 (S2), 0.6530 (S3)
• Resistance: 0.6700 (R1), 0.6735 (R2), 0.6810 (R3)
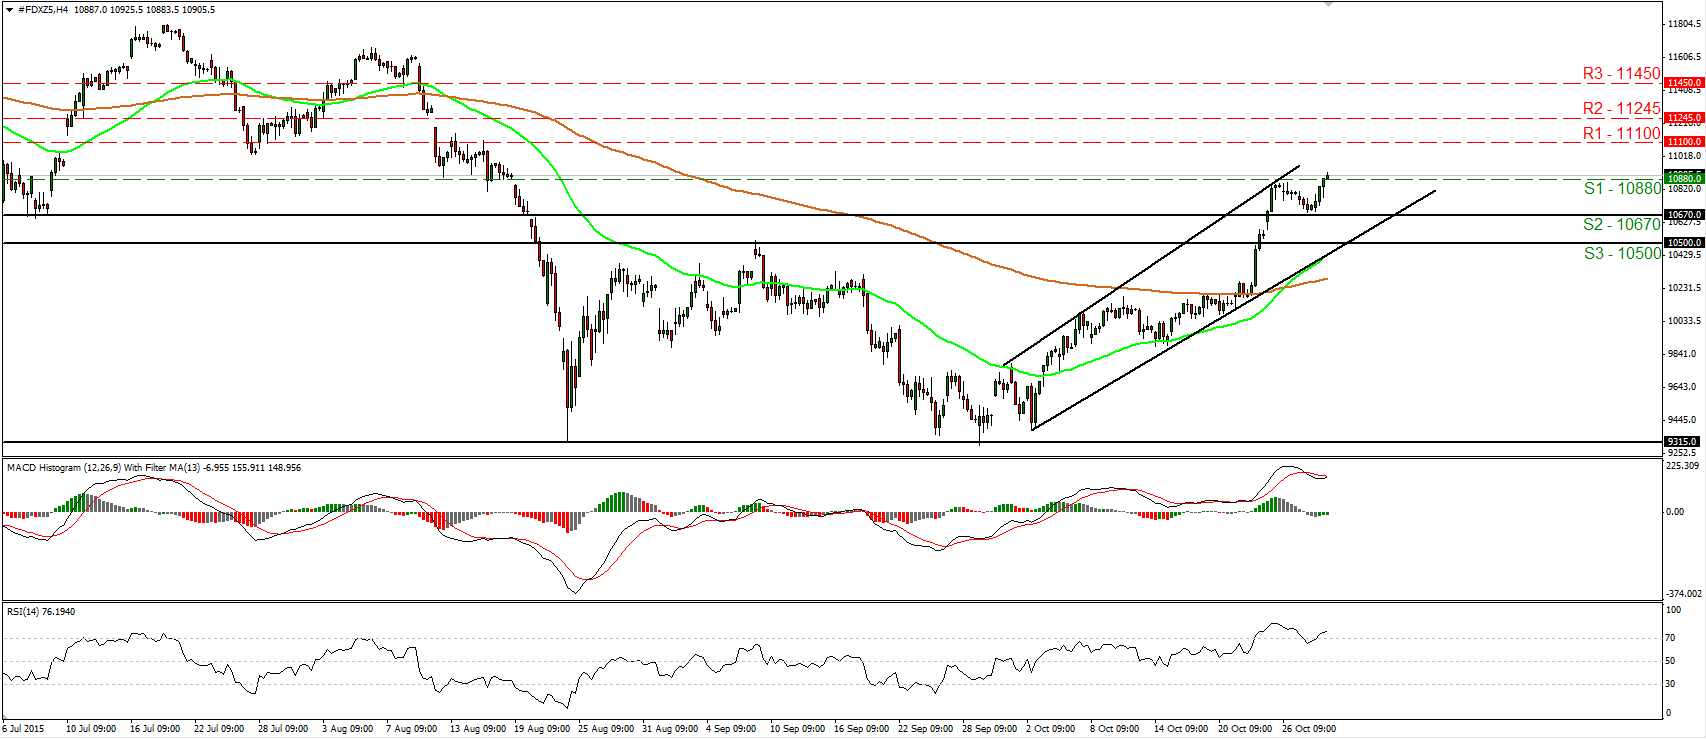
DAX futures rebound from 10670
• DAX futures edged higher yesterday, after they hit support at the 10670 (S2) barrier. Then the index emerged above the resistance (now turned into support) line of 10880 (S1). As long as the index is trading within a short-term upside channel, I would consider the near-term path to stay positive. Thus, I would expect the break above 10880 (S1) to pull the trigger for the resistance territory of 11100 (R1). Our short-term oscillators corroborate my view. The RSI turned up again and moved back above its 70 line, while the MACD, already positive, has turned north as well and looks ready to move above its trigger line. On the daily chart, the break above the psychological zone of 10500 (S3) signaled the completion of a possible double bottom formation. Moreover, on the 23rd of October buyers managed to overcome the key obstacle of 10670 (S2). These technical signs support that the index is likely to continue trading higher in the foreseeable future.
• Support: 10880 (S1), 10670 (S2), 10500 (S3)
• Resistance: 11100 (R1), 11245 (R2), 11450 (R3)
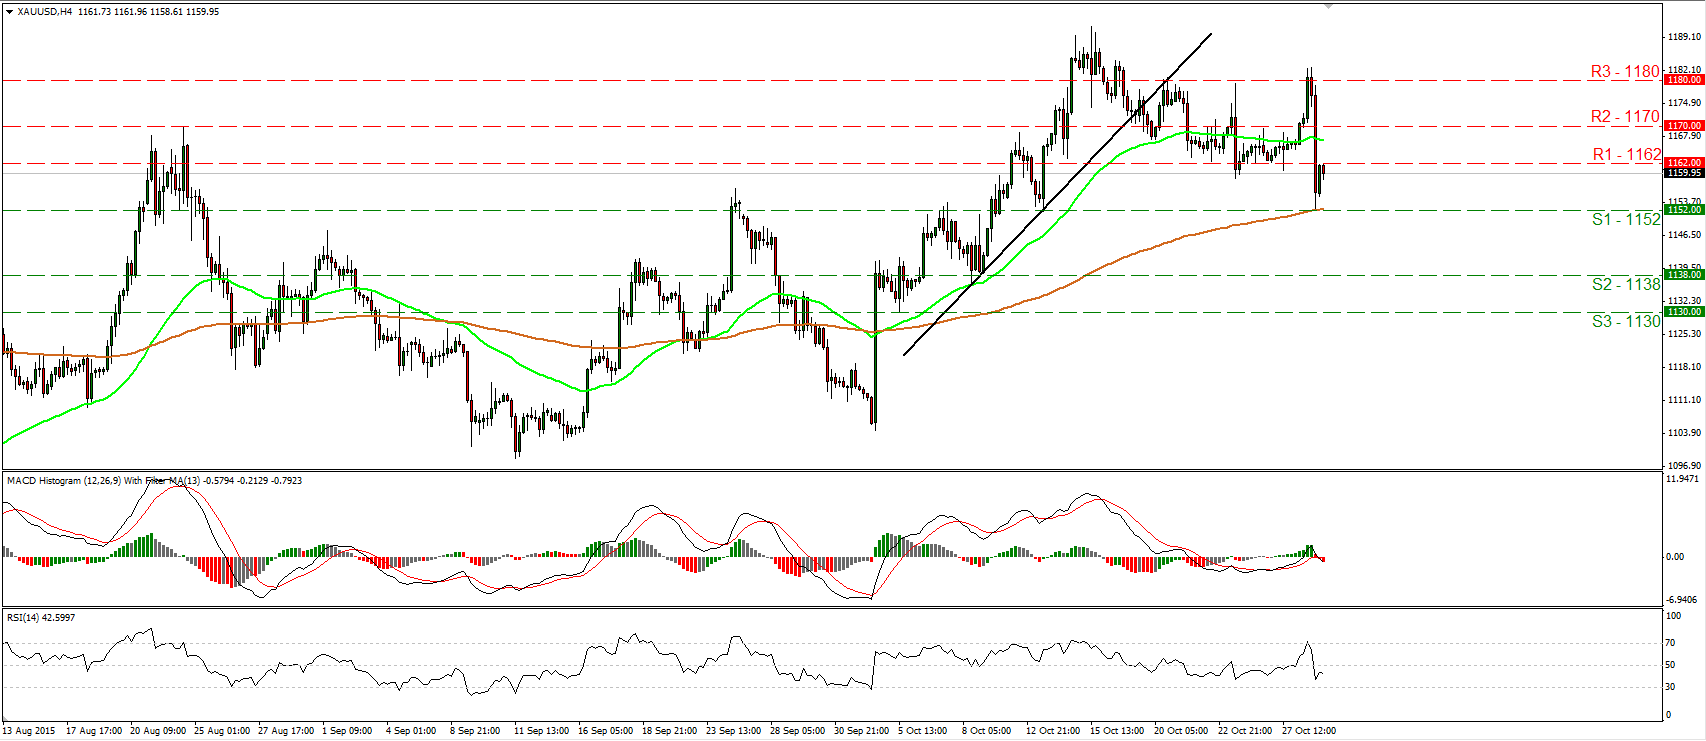
Gold falls and hits the 1152 support
• Gold traded higher on Wednesday, but hit resistance above 1180 (R3) and after the FOMC decision, it fell to hit support at the 1152 (S1) line, defined by the low of the 13th of October. Then the metal rebounded somewhat. The plunge confirmed a forthcoming lower low on the 4-hour chart and turned the picture back to the downside in my view. I believe that a clear break below 1152 (S1) is likely to open the way for our next support territory of 1138 (S2). Our oscillators reveal downside momentum and magnify the case for the precious metal to trade lower, at least in the short run. The RSI fell below its 50 line, while the MACD, has topped, turned negative and fell below its trigger line. On the daily chart, the medium-term outlook is still cautiously positive. As a result, I would consider the retreat started on the 15th of October as a corrective phase, at least for now.
• Support: 1152 (S1), 1138 (S2), 1130 (S3)
• Resistance: 1162 (R1), 1170 (R2), 1180 (R3)
USD/JPY still trades in a sideways mode
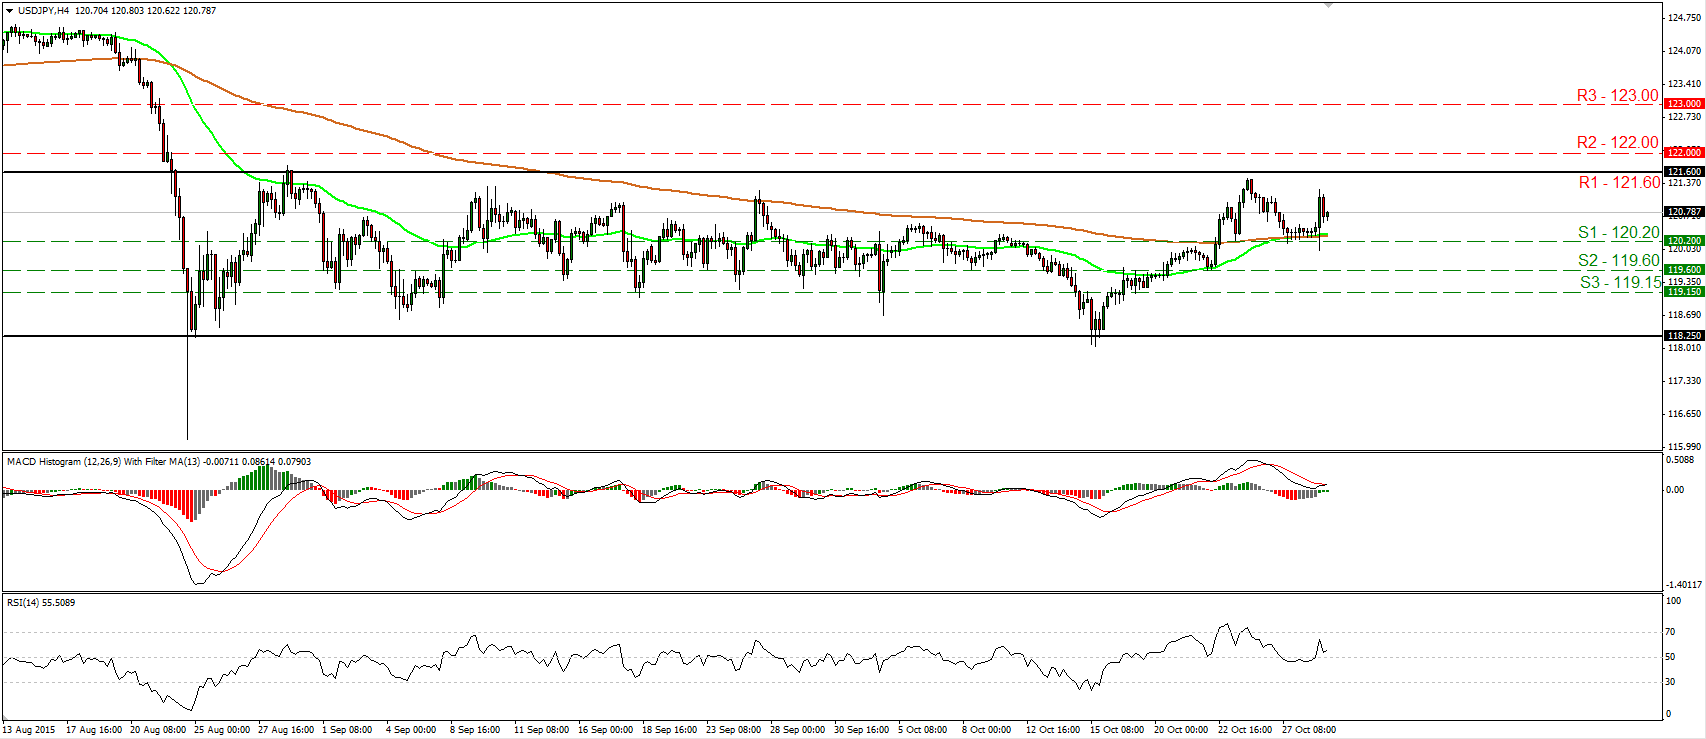
• USD/JPY traded higher after it hit support slightly below the 120.20 (S1) barrier, but fell short of reaching the key resistance zone of 121.60 (R1). The pair has been trading in a sideways mode between that resistance field and the support area of 118.25 since the last days of August, and therefore I would consider the medium-term picture to stay flat. I prefer to see a clear move above 122.00 (R2) before I switch my stance to positive and get more confident on more bullish extensions. As for the broader trend, the plunge on the 24th of August signaled the completion of a possible double top formation, which turned the medium-term outlook somewhat negative. However, the strong rebound from the 116.00 zone and the fact that USD/JPY still gyrates around the 120.00 figure, corroborate my choice to stand aside at the moment.
• Support: 120.20 (S1), 119.60 (S2), 119.15 (S3)
• Resistance: 121.60 (R1), 122.00 (R2), 123.00 (R3)

